
The practical answer
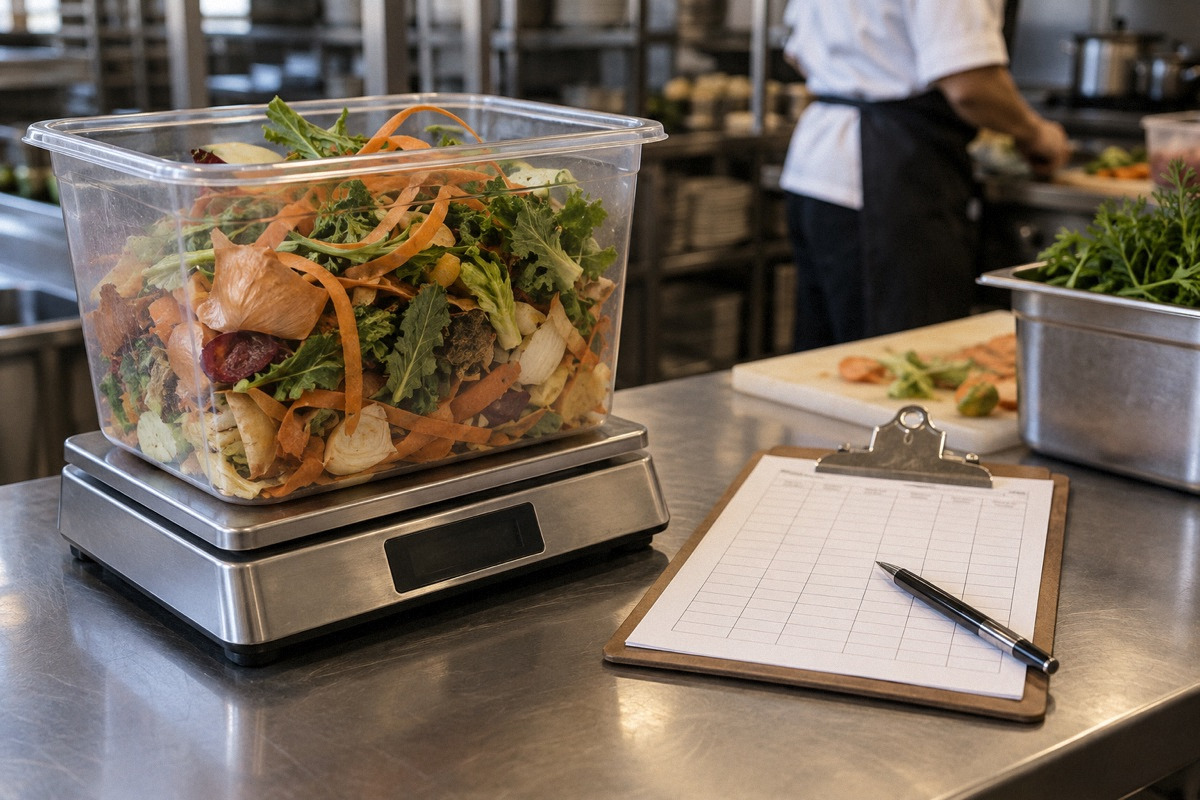
Industry-wide waste figures can't tell you what your own kitchen throws away. For two weeks, log every discarded item at the point of disposal. Record what it was, how much, why, and its cost at current invoice prices. Sort entries into spoilage, overproduction, prep trim, plate waste and errors, total each category, and act on the three largest. Then log one week a month to check the fixes held. A waste log only shows food that reaches the bin, so compare it with inventory-based food cost to catch losses it misses.
Why a borrowed waste statistic tells you little
A post on r/restaurantowners opened with a figure the poster said they had read somewhere: restaurants waste $75,000 a year on average in food thrown out. They asked whether that was accurate and why it was so high. No source was given. The first owner to reply in the recorded excerpt said their restaurant wasted almost nothing, perhaps $30 to $50 a month in a bad month, against roughly $750,000 in annual sales. Another commenter immediately asked whether that kitchen was serving mostly frozen fryer food.
Neither number is something to plan around. The $75,000 figure has no stated source, method or definition. The $30 to $50 figure is one owner's estimate of their own operation, which works out to roughly $360 to $600 a year, under a tenth of a percent of their stated sales. Industry waste figures also vary because definitions differ. Some count only food thrown away before service, some include plate scrapings, some value waste at menu price instead of cost, and some include beverages and packaging. Concepts differ too: a scratch kitchen with fresh produce will always trim more than one built on frozen, portioned product. The only useful number is your own, measured consistently.
What to count: five categories that point to different fixes
Waste is only actionable when you know why it happened, because each cause has a different remedy. Sorting every log entry into one of five categories turns a pile of discards into a list of problems with owners. Keep the categories few enough that staff can choose one in a second.
Prep trim deserves a note. Some of it is unavoidable, like onion skins and bones. The question is whether it is larger than the recipe card's yield assumes, or whether useful trim, such as vegetable ends for stock, is being thrown out. Plate waste is also a signal about portions and dishes, not just guests' appetites.
| Category | Examples | Usually points to |
|---|---|---|
| Spoilage | Expired dairy, slimy greens, product past its date mark | Ordering quantities, delivery cadence, rotation |
| Overproduction | Leftover rice, soup, batch sauce at close | Batch sizes and timing versus sales by daypart |
| Prep trim | Trim, peel, bones beyond expected yield | Yield assumptions, knife skills, supplier spec |
| Plate waste | Food left on returned plates | Portion size, dish quality, side choices |
| Errors and remakes | Wrong order, overcooked, dropped | Ticket clarity, training, station setup |
Setting up the log
Use a clipboard sheet or a shared spreadsheet on a kitchen tablet, located where food is actually thrown away. Each entry needs date and time, item, quantity with unit, category, a short reason, and the initials of the person logging it. Cost is easier to add afterward. Someone fills it in daily from the master price list, so cooks are not slowed by arithmetic during service.
Measure quantity the same way every time. A scale by the bin is best for bulk items. Counts work for portioned items like patties or desserts. For plate waste, which is hard to log plate by plate, weigh the scrap bin at the end of each service, or have dishwashers tally plates that come back substantially uneaten by dish. Write the method at the top of the sheet.
- Date and time
- Item and quantity, with unit (lb, oz, each, quart)
- Category: spoilage, overproduction, prep trim, plate, error
- Reason in a few words
- Initials
- Cost, added later from the master price list
Making it easy enough that staff actually log
A waste log fails when it is treated as a way to find someone to blame. If cooks think every entry will be held against them, discards will skip the log and go straight into the bin, and the numbers will look excellent and mean nothing. Say explicitly that the goal is to find process problems, and that a high log during the measurement weeks is useful.
Keep the sheet physically next to the bin and the walk-in door, pre-fill common items, and assign one person per shift to check that entries make sense before close. A short daily look by a manager, asking what the top item was today, keeps the habit alive more effectively than a weekly report nobody reads.
Worked example: two weeks of logging (hypothetical numbers)
All figures are invented to show how a log becomes a decision. They are not benchmarks.
A rice-heavy counter-service restaurant logs for 14 days, during which it records $36,000 in food sales. Totals by category are: spoilage $310, overproduction $240, prep trim $120, plate waste $90 and errors and remakes $60, for $820 in all. That is about 2.3 percent of food sales for the period, or roughly $410 a week. Over 52 weeks, that would be about $21,320 if nothing changed. Within overproduction, end-of-day cooked rice accounts for about $151, or roughly 18 pounds a night at an assumed $0.60 per cooked pound over 14 nights. Everything else in that category totals about $89.
That mirrors something an owner described in a separate r/restaurantowners thread, 'Cutting Costs?'. They said they portion out their food and white rice is the only thing left over at night. A log turns that observation into a number and puts it next to the other categories, so you can see whether rice is actually the biggest problem or just the most visible one. In this example, spoilage is larger.
| Category (hypothetical 14 days) | Cost | Share of logged waste |
|---|---|---|
| Spoilage | $310 | about 38% |
| Overproduction (rice about $151) | $240 | about 29% |
| Prep trim | $120 | about 15% |
| Plate waste | $90 | about 11% |
| Errors and remakes | $60 | about 7% |
| Total | $820 | about 2.3% of $36,000 food sales |
Acting on the top three, safely
Spoilage usually comes down to ordering and rotation. Look at which items spoiled most, compare order quantities with actual usage, and consider smaller, more frequent deliveries for those items where supplier minimums allow. The owner in the waste thread credited daily owner inventory, several delivery days a week from multiple suppliers, and running lean on perishables for their low waste. That is one unverified account, but the mechanism is sound. Our article on cross-utilization shows how sharing ingredients across dishes also cuts spoilage.
Overproduction is a batching problem. For the rice, an operational suggestion is to cook smaller batches staggered through the day to match sales by daypart, so the last batch is small. If leftover cooked rice is kept rather than discarded, it must be handled under your jurisdiction's time and temperature rules for cooked foods. Confirm with your health authority how it classifies cooked rice. In the District of Columbia, DC Health's inspection guidance gives the cooling requirement for hot potentially hazardous foods as 135°F to 70°F within 2 hours and 70°F to 41°F within a further 4 hours. It also states that refrigerated ready-to-eat potentially hazardous foods held over 24 hours must be date-marked, may be held up to 7 days at 41°F or below, and must be discarded once past their consume-by date. If you cannot meet those rules reliably, discard rather than keep.
Prep trim is a yield question. Measure actual yields on the top trimmed items and compare them with the recipe cards. If yield is worse than assumed, the cause may be technique, equipment or a change in supplier product, and the recipe card cost is wrong until it is updated.
What a waste log will not show you
A log only captures what someone writes down at the bin. Over-portioning never reaches the bin: the extra ounce of protein leaves on the plate and gets eaten. Unrecorded comps, staff meals that are not logged, and unexplained loss do not appear either. In the r/restaurantowners itemizing thread, a commenter who said they work in IT for a large restaurant company observed that predicted profitability goes out the window if a tray of burgers is wasted. That is why waste and costing have to be read together.
The check is to compare the log with inventory-based food cost. If actual food cost exceeds theoretical usage by more than the logged waste explains, the gap is somewhere else: portions, comps, receiving errors or loss. Our articles on the inventory food-cost formula and on theoretical versus actual usage cover how to investigate that gap fairly. A gap is a reason to review processes and records, not evidence that any particular person did something wrong.
Re-measuring monthly
After the initial two weeks and the first round of fixes, log one full week every month, keeping the same categories and measurement methods so results are comparable. Compare each category with the baseline. If spoilage fell after an ordering change, the change worked. If overproduction moved from rice to soup, the batching habit moved with it. Keep a running sheet of the monthly totals, the share of food sales and the actions taken, so a year from now you can say what your waste actually is, measured, rather than repeating a number someone read somewhere.
If you want a single headline figure, use logged waste as a percentage of food sales for the logged week. Report it alongside the method, because a figure that excludes plate waste or values discards at menu price is not comparable with one that does not.
- Log at the bin, every discard, for two full weeks to set a baseline.
- Use five categories and one measurement method per category.
- Cost entries daily from current invoice prices.
- Act on the top three categories; assign each to a named person.
- Follow your health authority's cooling, date-marking and discard rules for any kept leftovers.
- Log one week per month and compare with baseline and inventory food cost.
Questions that come up next
How much food does the average restaurant waste?
There is no reliable single answer. The $75,000-a-year figure raised in an r/restaurantowners thread had no stated source. One owner in the same thread estimated only $30 to $50 a month, an unverified self-report. Definitions, concepts and valuation methods vary widely. Measure your own waste with a two-week log, expressed as cost and as a share of food sales.
Can I keep leftover cooked rice for the next day?
Only if you meet your jurisdiction's cooling, date-marking and holding rules. In DC, DC Health guidance requires hot potentially hazardous foods to cool from 135°F to 70°F within 2 hours and to 41°F within 4 more hours, and date-marked ready-to-eat foods may be held up to 7 days at 41°F or below. Confirm local classification and requirements; otherwise, discard.
Sources & context
Forum accounts are unverified experiences. Read government sources for their stated jurisdiction and check requirements with the responsible authority for your location.
- r/restaurantowners: How much food does your restaurant waste yearly?reddit · Recorded search excerpt (a direct inspection captured no body text). Supports the poster's unsourced $75,000 figure, one owner's self-reported $30-50 monthly waste on about $750,000 sales with daily inventory, multiple delivery days and lean perishables, and a reply asking whether their food was mostly frozen. None of these numbers are verified.
- r/restaurantowners: Cutting Costs?reddit · Recorded search excerpt. Supports the owner's statement that they portion food and that white rice is the only item left over at night. Used to motivate the overproduction example.
- r/restaurantowners: Tips for itemizing costs of each menu itemreddit · Directly inspected thread text. Used only for a commenter's remark (self-described large-chain IT worker) that predicted profitability goes out the window if a tray of burgers is wasted.
- DC Health: Understanding Food Establishment Inspectionsgovernment · District of Columbia guidance page (marked updated June 27, 2018) summarizing DCMR Title 25. Supports the DC cooling parameters (135°F to 70°F within 2 hours; 70°F to 41°F within 4 hours), date marking for ready-to-eat potentially hazardous foods held over 24 hours, the 7-day limit at 41°F or below, and discarding past consume-by dates. DC only; it does not name cooked rice, so classification should be confirmed locally.


